Whenever we are working on projects built with PHP frameworks like Laravel or CodeIgniter, we often need to debug specific screens. How can we effectively debug in these situations?
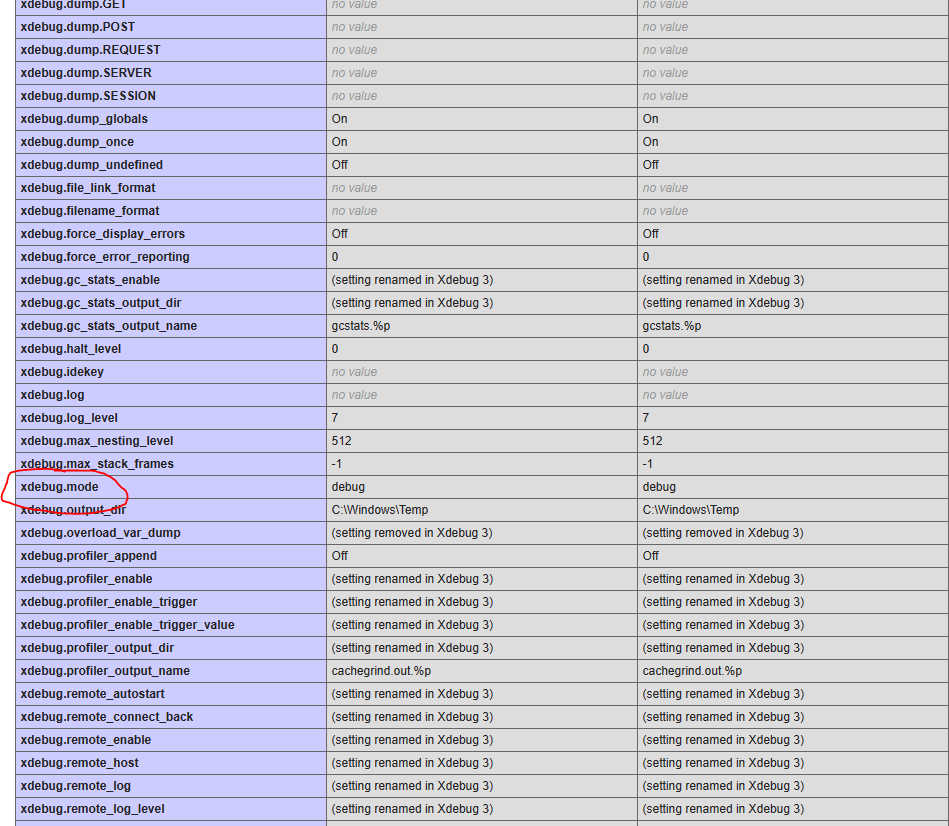
• Open the php.ini file in a text editor. Look for sections related to Xdebug. Common settings you will find include:
php --version
PHP 8.0.30 (cli) (built: Sep  1 2023 14:15:38) ( ZTS Visual C++ 2019 x64 )
Copyright (c) The PHP Group
Zend Engine v4.0.30, Copyright (c) Zend Technologies
• Zend extension is a specialized type of PHP extension that's integrated directly into the Zend Engine, the core of PHP responsible for executing scripts.
zend_extension=php_xdebug.dll
xdebug.mode=debug
• To obtain the php_xdebug.dll file, download it from https://xdebug.org/download, ensuring to select the version compatible with PHP 8.0. Once downloaded, rename the file to php_xdebug.dll and place it in the 'C:\path\to\php\ext' directory.
php --version
PHP 8.0.30 (cli) (built: Sep  1 2023 14:15:38) ( ZTS Visual C++ 2019 x64 )
Copyright (c) The PHP Group
Zend Engine v4.0.30, Copyright (c) Zend Technologies
    with Xdebug v3.3.1, Copyright (c) 2002-2023, by Derick Rethans
• As you can see from the output, Xdebug is already installed. Next, navigate to http://localhost/dashboard/phpinfo.php to check for Xdebug details.
• Let us start by setting up Xdebug in PhpStorm for a Laravel project. First, open PhpStorm and navigate to File » PHP » Debug.
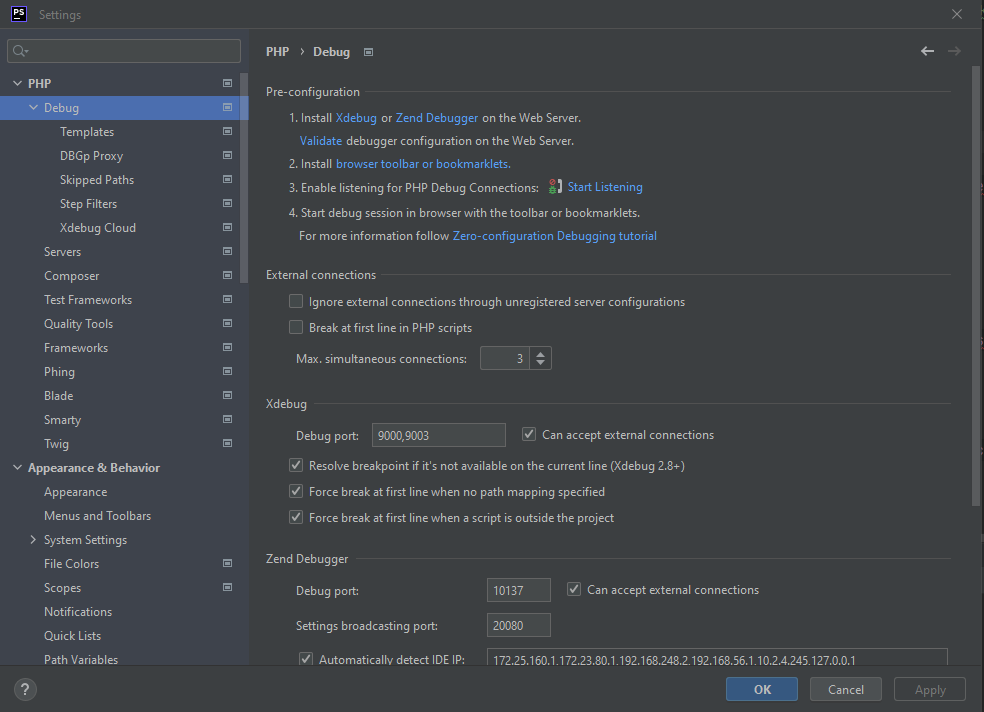
Note: Once you activate debugging in your IDE tool, it will use port 9000 or 9003 for Xdebug mode.
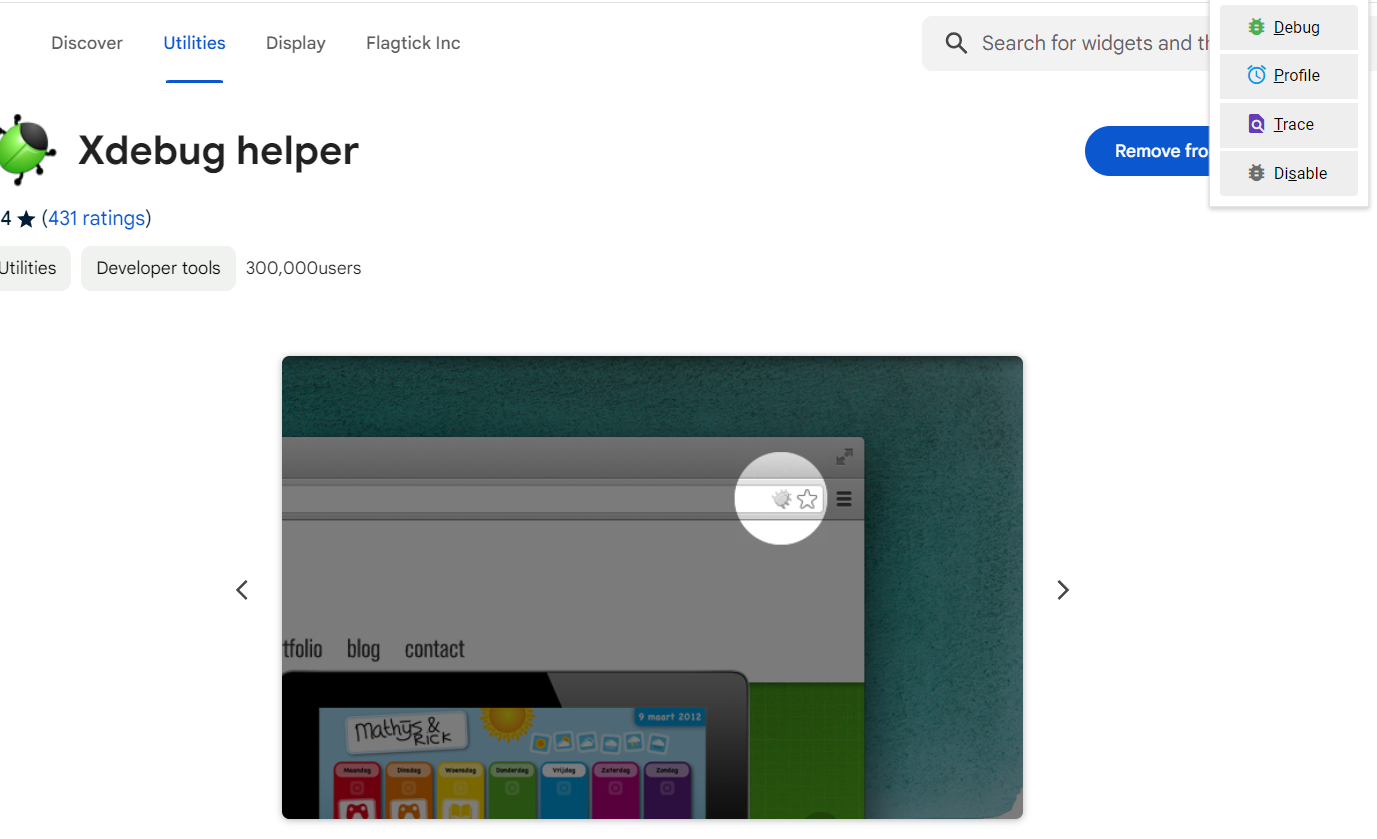
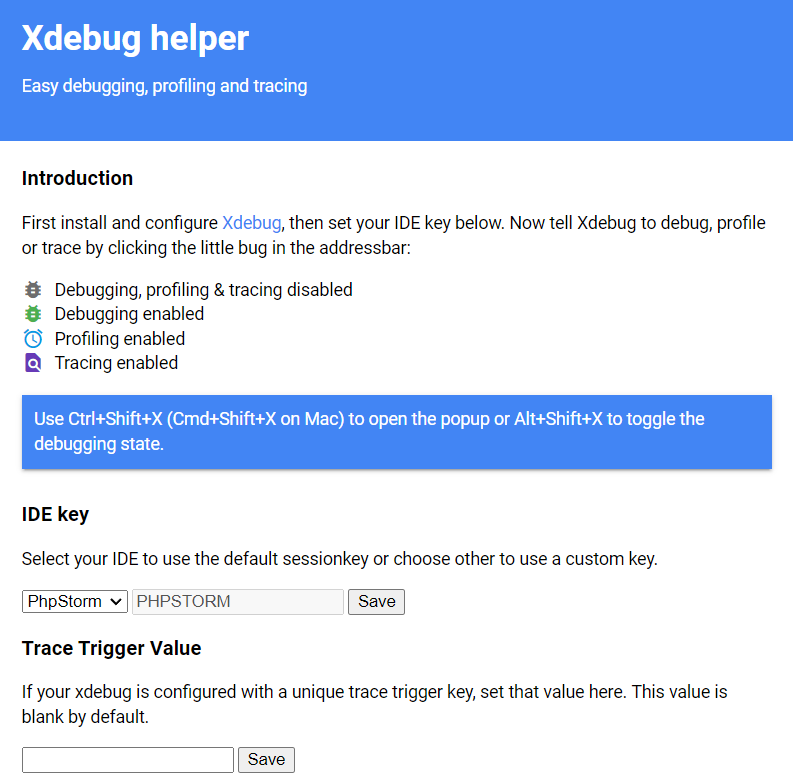
• Installing Xdebug Helper browser extension allows you to easily toggle Xdebug debugging mode on and off directly from your browser.
• After that, access the options of the Xdebug Helper tool to configure settings such as the IDE key...
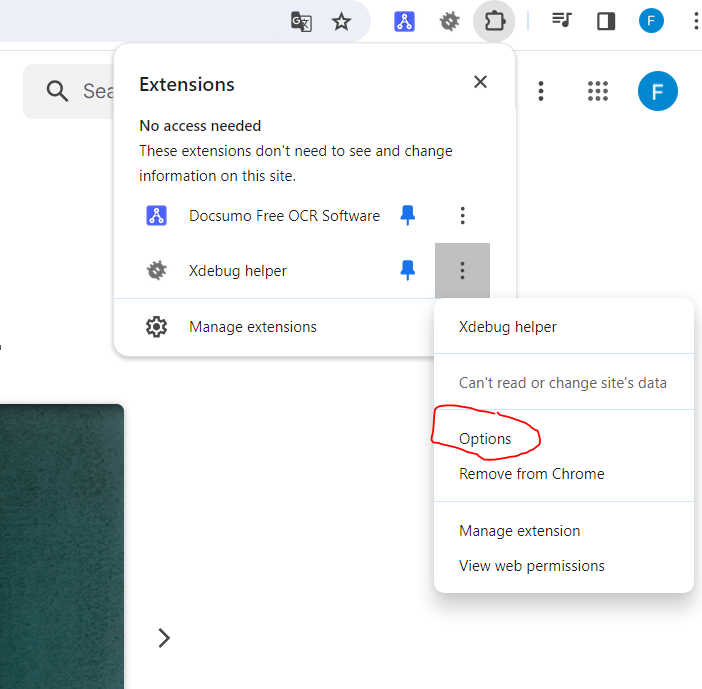
• In Options, ensure that you have selected the default session key to toggle Xdebug on for that IDE.
• After completing that step, switch to your IntelliJ IDE and set breakpoints at suitable locations. Then, navigate to Run » Start Listening for PHP Debug Connections.
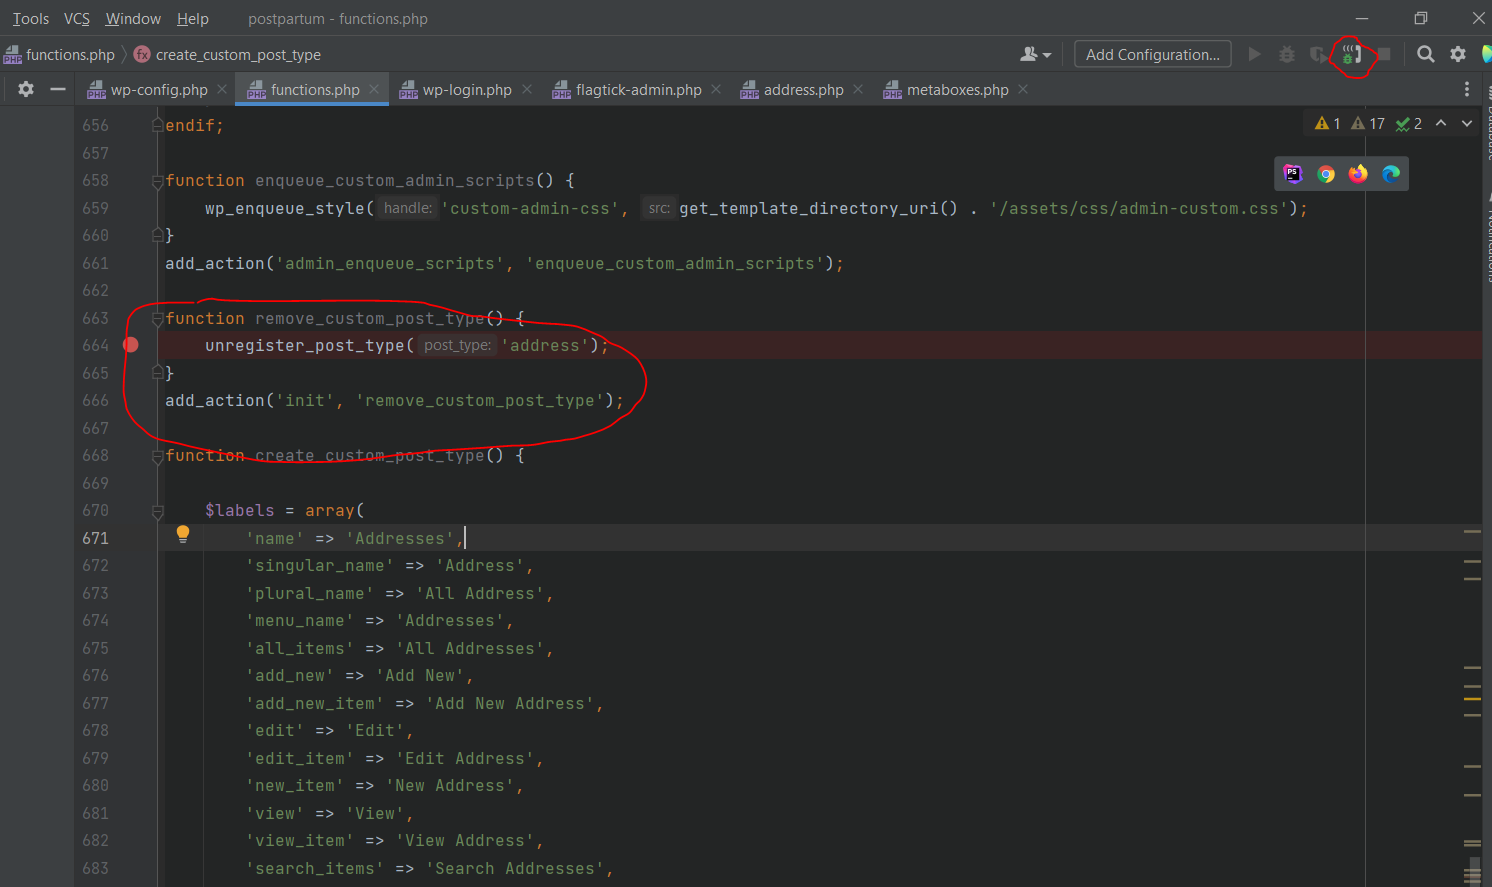
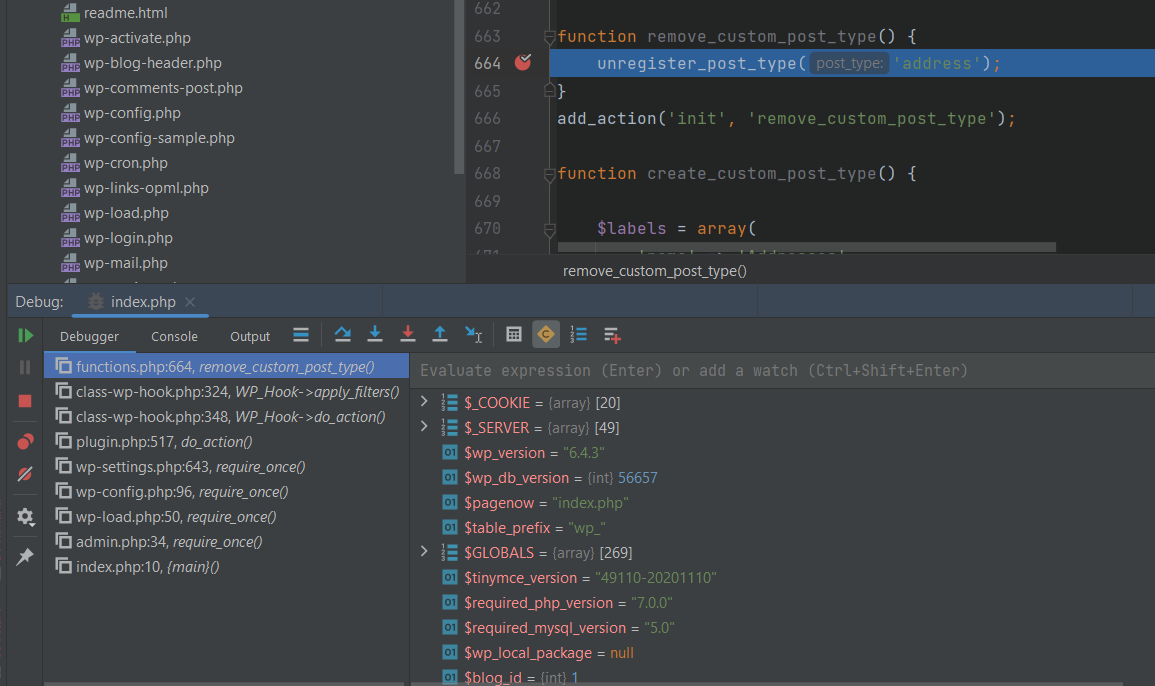
Next, in the Xdebug extension for Google Chrome, choose either `Disable` or `Debug` to enable debugging at the breakpoint in your IDE. Don't forget to reload the browser after making this change.
• In the example provided, we debugged a WordPress website using XAMPP as the server. How does debugging differ for a Laravel project, or is it similar?
Firstly, ensure that you have already started listening for PHP debug connections in IntelliJ IDE. Then, run php artisan serve to start the Laravel application. You should see a dialog to confirm the connection between Xdebug and the IDE.
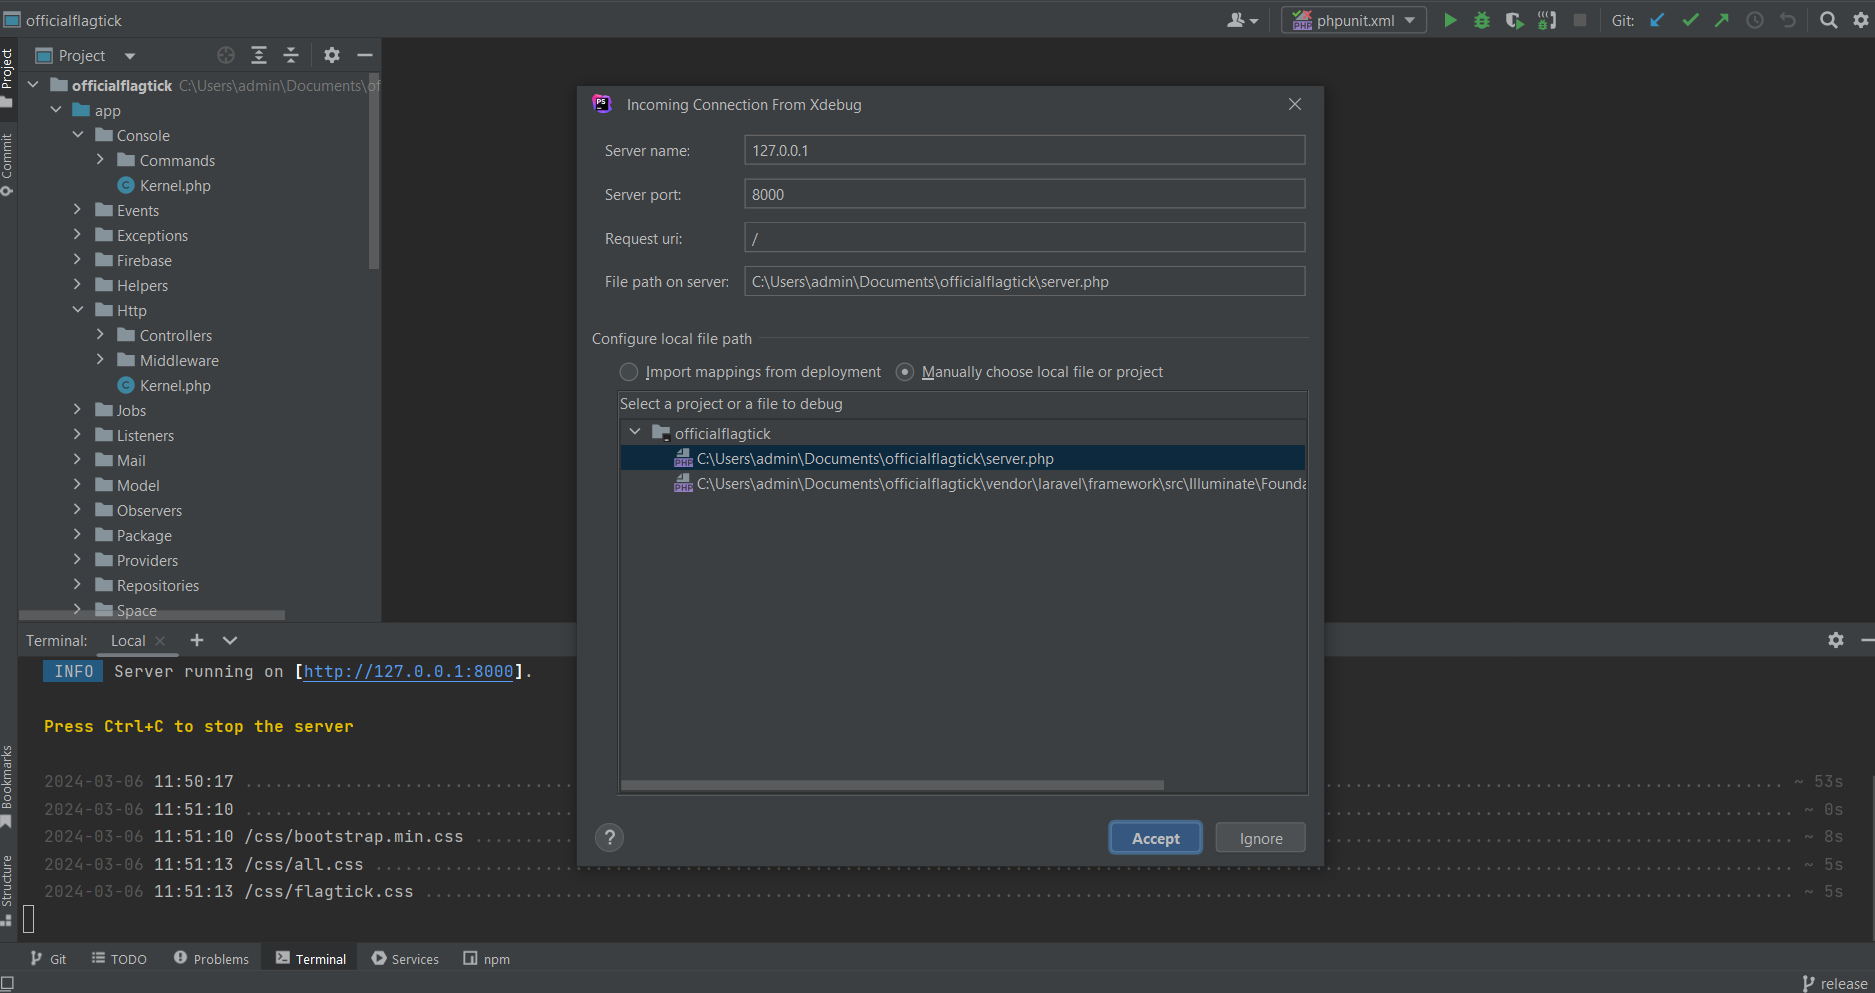
Once you press `Accept`, you will notice that the debug process is targeted to the breakpoint.
