Grafana is renowned as a powerful tool for effortlessly monitoring services, including Apache2. By integrating Grafana with data sources like Prometheus, InfluxDB, or Graphite, you can visualize Apache2 metrics such as requests per second, response time, server status, and more.
I. Installing Grafana Service on Ubuntu
To begin installing Grafana Service on Ubuntu, first update the list of available software packages from the configured repositories on the system using either `apt-get update -y` or `sudo apt-get update -y`.
$ apt-get update -y
Hit:1 http://ap-southeast-1.ec2.archive.ubuntu.com/ubuntu focal InRelease
Get:2 http://ap-southeast-1.ec2.archive.ubuntu.com/ubuntu focal-updates InRelease [114 kB]
Hit:3 http://ap-southeast-1.ec2.archive.ubuntu.com/ubuntu focal-backports InRelease
Hit:4 http://autoinstall.plesk.com/pool/PSA_18.0.59_14022 focal InRelease
Hit:5 http://autoinstall.plesk.com/PHP74_17 focal InRelease
Hit:6 http://autoinstall.plesk.com/PHP80_17 focal InRelease
Hit:7 http://autoinstall.plesk.com/PHP82_17 focal InRelease
Hit:8 http://autoinstall.plesk.com/pool/WPB_18.0.55_74 all InRelease
Hit:9 https://autoinstall.plesk.com/grafana/deb stable InRelease
Hit:10 https://autoinstall.plesk.com/DRWEB_6.0.2.9 focal InRelease
Hit:11 http://security.ubuntu.com/ubuntu focal-security InRelease
Fetched 114 kB in 1s (102 kB/s)
Reading package lists... Done
Next, install several essential packages necessary for performing various tasks on Ubuntu and other Debian-based Linux distributions.
apt-get install wget curl gnupg2 apt-transport-https software-properties-common -y
Note: Assuming our location is /var/www/vhosts/<domain>/grafana/, we will use `chmod -R 777` to set permissions for the new folder named grafana, and then download the repository inside it.
Conduct download Grafana's GPG (GNU Privacy Guard) key from the specified URL and then add it to the list of trusted keys used by the Advanced Package Tool (APT) on Debian-based systems.
wget -q -O - https://packages.grafana.com/gpg.key | apt-key add -
Next, add the Grafana repository to APT with the following command:
echo "deb https://packages.grafana.com/oss/deb stable main" | tee -a /etc/apt/sources.list.d/grafana.list
Once the repository has been added to your system, you can update it using the following command:
apt-get update -y
Now, you can install Grafana by executing the following command:
/grafana$ sudo apt-get install grafana -y
Reading package lists... Done
Building dependency tree
Reading state information... Done
grafana is already the newest version (10.1.5).
0 upgraded, 0 newly installed, 0 to remove and 4 not upgraded.
After installing the Grafana package, verify the Grafana version using the following command:
/grafana$ grafana-server -v
Version 10.1.5 (commit: 849c612fcb, branch: HEAD)
As you can see, setting up Grafana affects `/lib/systemd/system` rather than `/etc/systemd/system`. You will find the grafana-server.service file in `/lib/systemd/system`. Now, start the Grafana service and set it to start automatically when the system reboots:
systemctl start grafana-server
systemctl enable grafana-server
You can now verify the status of Grafana by using the following command:
/$ systemctl status grafana-server
● grafana-server.service - Grafana instance
     Loaded: loaded (/lib/systemd/system/grafana-server.service; enabled; vendor preset: >
     Active: active (running) since Fri 2024-04-05 06:57:59 UTC; 1 weeks 5 days ago
       Docs: http://docs.grafana.org
   Main PID: 2027718 (grafana)
      Tasks: 22 (limit: 4686)
     Memory: 107.6M
     CGroup: /system.slice/grafana-server.service
             ├─2027718 /usr/share/grafana/bin/grafana server --config=/etc/grafana/grafan>
             └─2027725 /var/lib/grafana/plugins/plesk-json-backend-datasource/dist/gpx_pl>


Apr 16 06:26:38 flagtickhostwebsite systemd[1]: /lib/systemd/system/grafana-server.servic>
Apr 16 06:31:44 flagtickhostwebsite systemd[1]: /lib/systemd/system/grafana-server.servic>
Apr 16 06:31:44 flagtickhostwebsite systemd[1]: /lib/systemd/system/grafana-server.servic>
Apr 16 06:31:45 flagtickhostwebsite systemd[1]: /lib/systemd/system/grafana-server.servic>
Apr 16 06:31:45 flagtickhostwebsite systemd[1]: /lib/systemd/system/grafana-server.servic>
Apr 16 06:31:45 flagtickhostwebsite systemd[1]: /lib/systemd/system/grafana-server.servic>
Apr 16 06:31:46 flagtickhostwebsite systemd[1]: /lib/systemd/system/grafana-server.servic>
Apr 17 11:41:05 flagtickhostwebsite systemd[1]: /lib/systemd/system/grafana-server.servic>
Apr 17 11:41:05 flagtickhostwebsite systemd[1]: /lib/systemd/system/grafana-server.servic>
Apr 17 11:41:05 flagtickhostwebsite systemd[1]: /lib/systemd/system/grafana-server.servic>
lines 1-21/21 (END)
II. Launch Grafana With Specific Port
In practice, the port used by Grafana may conflict with other services like Redmine or Elasticsearch. Let us use this command to search through plain-text data sets for lines containing the string http_port.
/$ grep -i http_port /etc/grafana/grafana.ini
http_port = 3030

# The full public facing url you use in browser, used for redirects and emails
# If you use reverse proxy and sub path specify full url (with sub path)
root_url = https://grafana.flagtickgroup.com/

# Serve Grafana from subpath specified in `root_url` setting. By default it is set to `false` for compatibility reasons.
serve_from_sub_path = true

# https certs & key file
cert_file = /opt/psa/var/certificates/scfu6Xa3R
cert_key = /opt/psa/var/certificates/scfNJGnJT
Note: We will cover generating the `cert_file` and `cert_key` parameters using free SSL self-certification from the Plesk panel for subdomain in next section.
Let verify whether the Uncomplicated Firewall (UFW) package is installed on the system. If UFW is installed, the command will display information about the package, indicating its presence. Conversely, if UFW is not installed, the command will produce no output.
dpkg -l | grep ufw
Then, check whether the firewall service is enabled on a Linux system.
ufw status
In some cases, if you haven't installed firewall for Linux yet, you can use these commands to install and enable it.
apt -y install ufw
ufw enable
If the firewall blocks port 3030, it impacts execution of curl command to connect to resources on that port. Thus, it is necessary to check ufw. Thus, we should open the port on the firewall.
sudo ufw allow 3030/tcp
Now, Grafana is up and running, and it is listening on port 3030. You can recognize this by using the following command:
$ ss -antpl | grep 3030
LISTEN 0      4096                                 127.0.0.1:3030       0.0.0.0:*
In the other hand, you can use curl to check with 127.0.0.1:3030.
$ curl --verbose 127.0.0.1:3030
*   Trying 127.0.0.1:3030...
* TCP_NODELAY set
* Connected to 127.0.0.1 (127.0.0.1) port 3030 (#0)
> GET / HTTP/1.1
> Host: 127.0.0.1:3030
> User-Agent: curl/7.68.0
> Accept: */*
>
* Mark bundle as not supporting multiuse
< HTTP/1.1 302 Found
< Cache-Control: no-store
< Content-Type: text/html; charset=utf-8
< Location: /modules/grafana/service/login
< Set-Cookie: redirect_to=%2Fmodules%2Fgrafana%2Fservice%2F; Path=/modules/grafana/service; HttpOnly; SameSite=Lax
< X-Content-Type-Options: nosniff
< X-Xss-Protection: 1; mode=block
< Date: Wed, 17 Apr 2024 14:24:51 GMT
It indicates that the requested resource at 127.0.0.1:3030 has been temporarily moved to `/modules/grafana/service/login`, and the client should follow the redirection specified in the Location header.
$ curl --verbose https://grafana.flagtickgroup.com/modules/grafana/service/login
Note: If you are not using service like curl to access it, you can disable port 3030 and avoid making it public. Instead, you can run it as proxy with subdomain for end users to access.
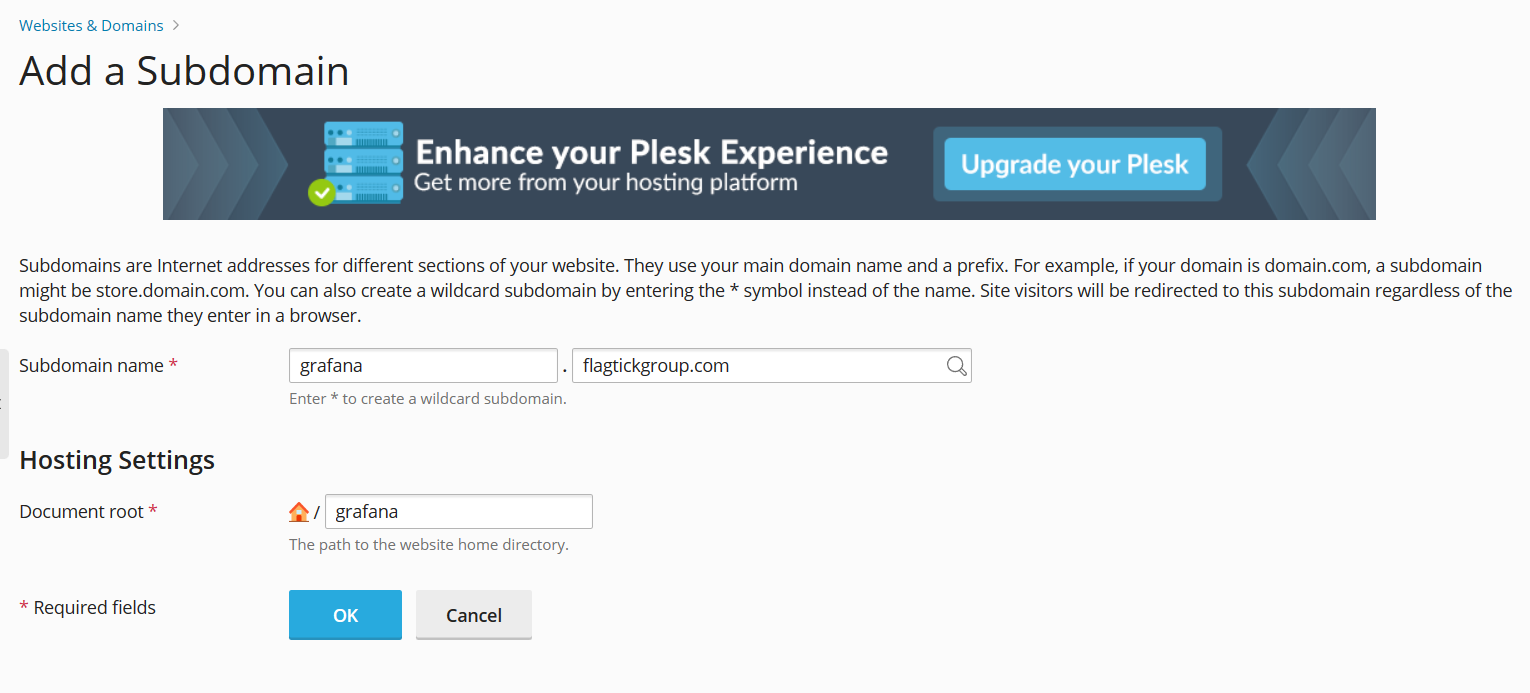
III. Setting Up Subdomain On Web Hosting
Here, we will be using the Plesk control panel as our hosting management tool to create subdomain under the main domain flagtickgroup.com. If you are using different control panel like cPanel, you can follow similar steps.
In some situations, Content Delivery Network (CDN) serves as an intermediary between the original server and the client, managing tasks such as caching and advanced configurations. For this purpose, we will be using Cloudflare as our CDN provider. Therefore, you may need to set up an IP address for this subdomain.

Use the nslookup command to query DNS servers and retrieve information about domain names, including IP addresses, specifically for the created subdomain.
$ nslookup grafana.flagtickgroup.com
Server:127.0.0.53
Address:127.0.0.53#53

Non-authoritative answer:
Name:grafana.flagtickgroup.com
Address: xxx.xxx.xxx.xxx
Name:grafana.flagtickgroup.com
Address: xxx.xxx.xxx.xxx
Name:grafana.flagtickgroup.com
Address: xxxx:xxxx:xxxx::xxxx:xxxx
Name:grafana.flagtickgroup.com
Address: xxxx:xxxx:xxxx::xxxx:xxxx
Grafana not serving any content when accessed through subdomain without files in the directory, you can set up reverse proxy configuration in your web server (e.g., Apache or Nginx).
sudo a2enmod proxy
sudo a2enmod proxy_http
sudo a2enmod proxy_balancer
sudo a2enmod lbmethod_byrequests
Update the virtual host configuration file for your subdomain to include the reverse proxy directives. For example, if using Apache, edit the virtual host configuration file:
/etc/apache2/sites-available$ ls -a
.                 000-default.conf.save           nano.save
..                default-ssl.conf                000-default.conf  grafana.flagtickgroup.com.conf
Let us proceed to modify the file grafana.flagtickgroup.com.conf as follows:
<VirtualHost *:80>
    ServerName grafana.flagtickgroup.com

    ProxyPass / http://localhost:3030/
    ProxyPassReverse / http://localhost:3030/

    ErrorLog ${APACHE_LOG_DIR}/redmine_error.log
    CustomLog ${APACHE_LOG_DIR}/redmine_access.log combined
</VirtualHost>
Note: Since Grafana doesn't serve any content from a specific directory like traditional web servers, there is no need to include DocumentRoot or Directory directives in its configuration file. Instead, the proxy directives are used to forward requests to the Grafana server.
Activate the virtual host configuration and then restart Apache to ensure the changes take effect.
sudo systemctl reload apache2
sudo a2ensite subdomain.conf
sudo systemctl restart apache2
When setting up Grafana to run on port 3030 within the subdomain grafana.flagtickgroup.com, you may need to refer to the file located at /etc/apache2/plesk.conf.d/vhosts/grafana.flagtickgroup.com.conf. This file is often used to configure Apache's virtual host settings, including proxy rules and directives for forwarding requests from port 80 (HTTP) or port 443 (HTTPS) to Grafana running on port 3030.
<IfModule mod_ssl.c>

       <VirtualHost 172.26.1.162:7081 >
       ServerName "grafana.flagtickgroup.com"
       ServerAlias "www.grafana.flagtickgroup.com"
       ServerAlias "ipv4.grafana.flagtickgroup.com"
       UseCanonicalName Off
       ProxyPreserveHost On
       ProxyPass / http://localhost:3030/
       ProxyPassReverse / http://localhost:3030/

       CustomLog /var/www/vhosts/system/grafana.flagtickgroup.com/logs/access_ss>
       ErrorLog "/var/www/vhosts/system/grafana.flagtickgroup.com/logs/error_log"

       DocumentRoot "/var/www/vhosts/flagtickgroup.com/grafana"
Check if grafana.flagtickgroup.com exists, list all files and directories, including hidden ones, in the directory `/var/www/vhosts/system/`.
ls -a /var/www/vhosts/system/
After restarting Apache with sudo systemctl restart apache2, the configuration changes will be saved in `/var/www/vhosts/system/grafana.flagtickgroup.com/conf/httpd.conf`.
$ sudo cat /var/www/vhosts/system/grafana.flagtickgroup.com/conf/httpd.conf
#ATTENTION!
#
#DO NOT MODIFY THIS FILE BECAUSE IT WAS GENERATED AUTOMATICALLY,
#SO ALL YOUR CHANGES WILL BE LOST THE NEXT TIME THE FILE IS GENERATED.
#IF YOU REQUIRE TO APPLY CUSTOM MODIFICATIONS, PERFORM THEM IN THE FOLLOWING FILES:
#/var/www/vhosts/system/grafana.flagtickgroup.com/conf/vhost.conf
#/var/www/vhosts/system/grafana.flagtickgroup.com/conf/vhost_ssl.conf
<IfModule mod_ssl.c>

     <VirtualHost 172.26.1.162:7081 >
     ServerName "grafana.flagtickgroup.com"
     ServerAlias "www.grafana.flagtickgroup.com"
     ServerAlias "ipv4.grafana.flagtickgroup.com"
     UseCanonicalName Off
     ProxyPreserveHost On
     ProxyPass / http://localhost:3030/
     ProxyPassReverse / http://localhost:3030/

     CustomLog /var/www/vhosts/system/grafana.flagtickgroup.com/logs/access_ssl_log plesklog

     ErrorLog "/var/www/vhosts/system/grafana.flagtickgroup.com/logs/error_log"

     DocumentRoot "/var/www/vhosts/flagtickgroup.com/grafana"
Open your web browser and navigate to the grafana.flagtickgroup.com subdomain to confirm that Grafana is accessible as expected.
Some times, you may encounter "TOO MANY REQUESTS" errors due to SSL-related issues. To avoid this problem, you can use self-signed SSL certificate to secure the integration of the subdomain grafana.flagtickgroup.com. This helps prevent such errors from occurring.
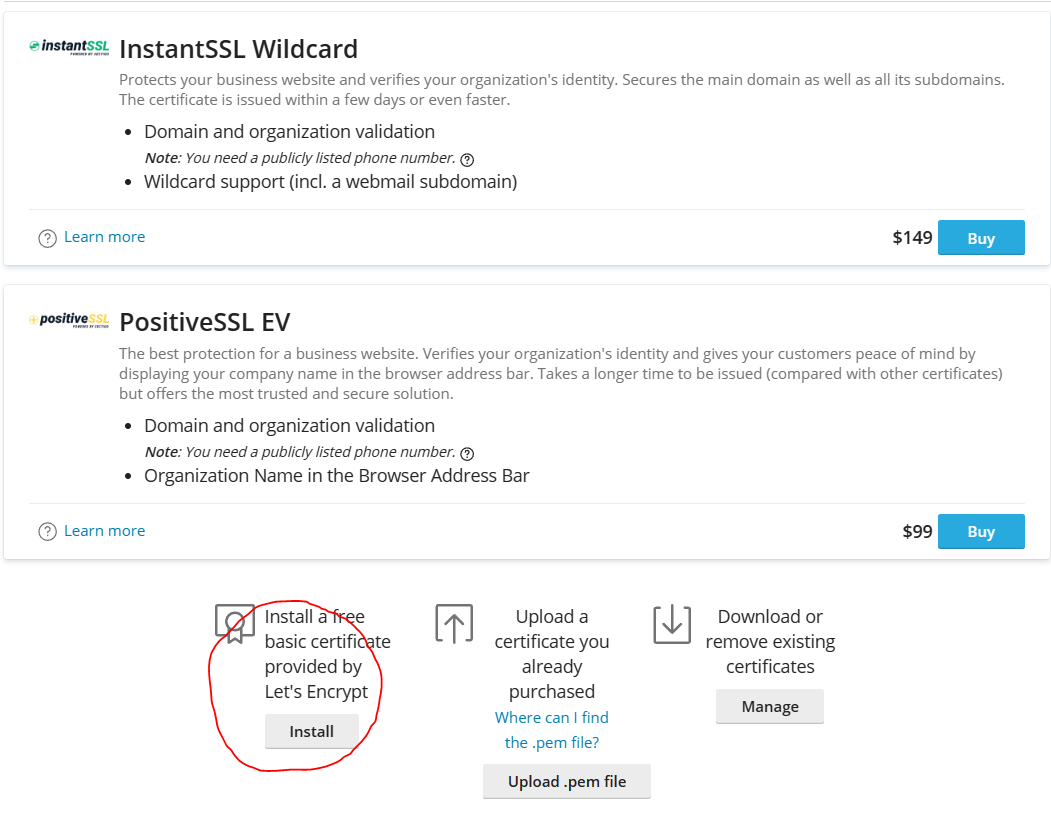
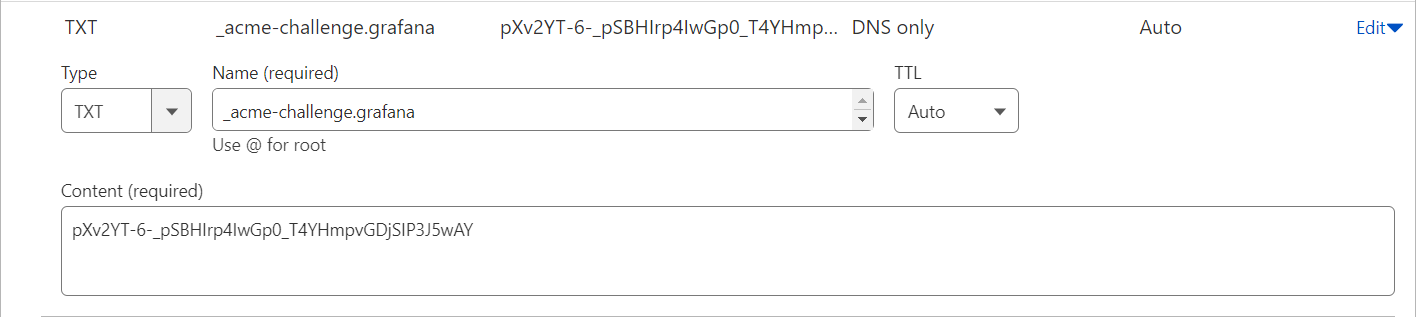
Press the Reissue Certificate button to install a free basic certificate provided by Let's Encrypt.
Select the option Secure the wildcard domain (including www and webmail), including the www subdomain.
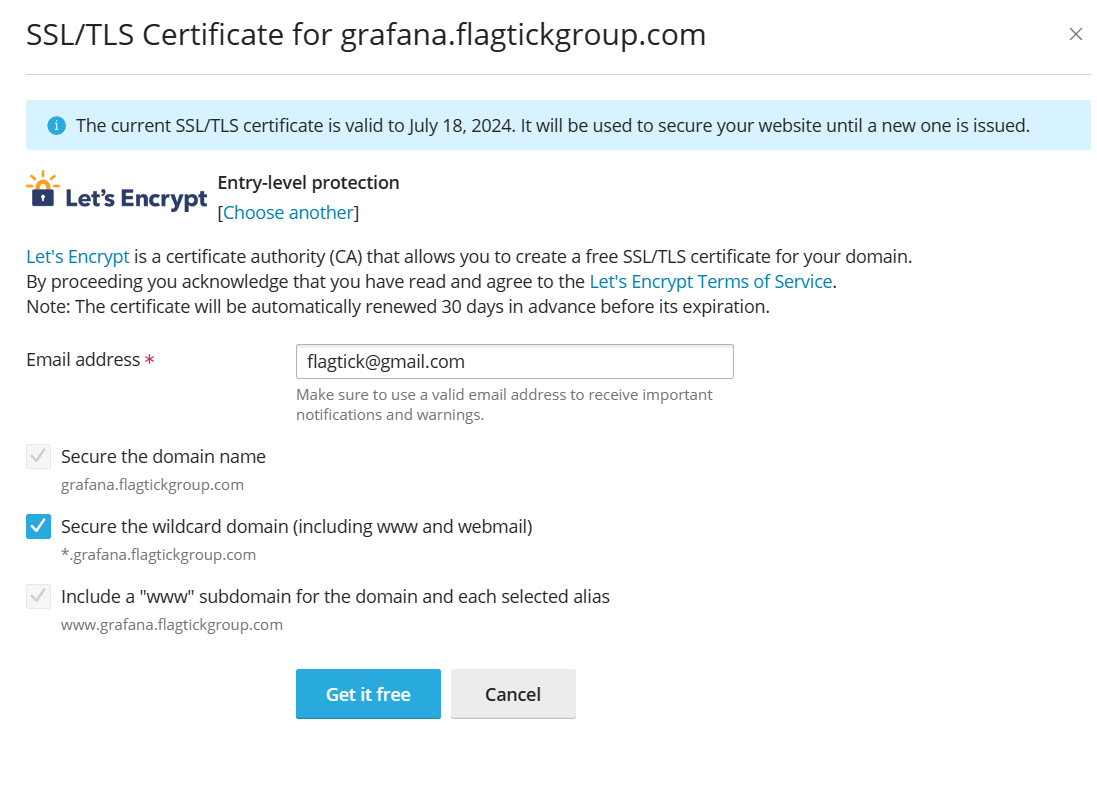
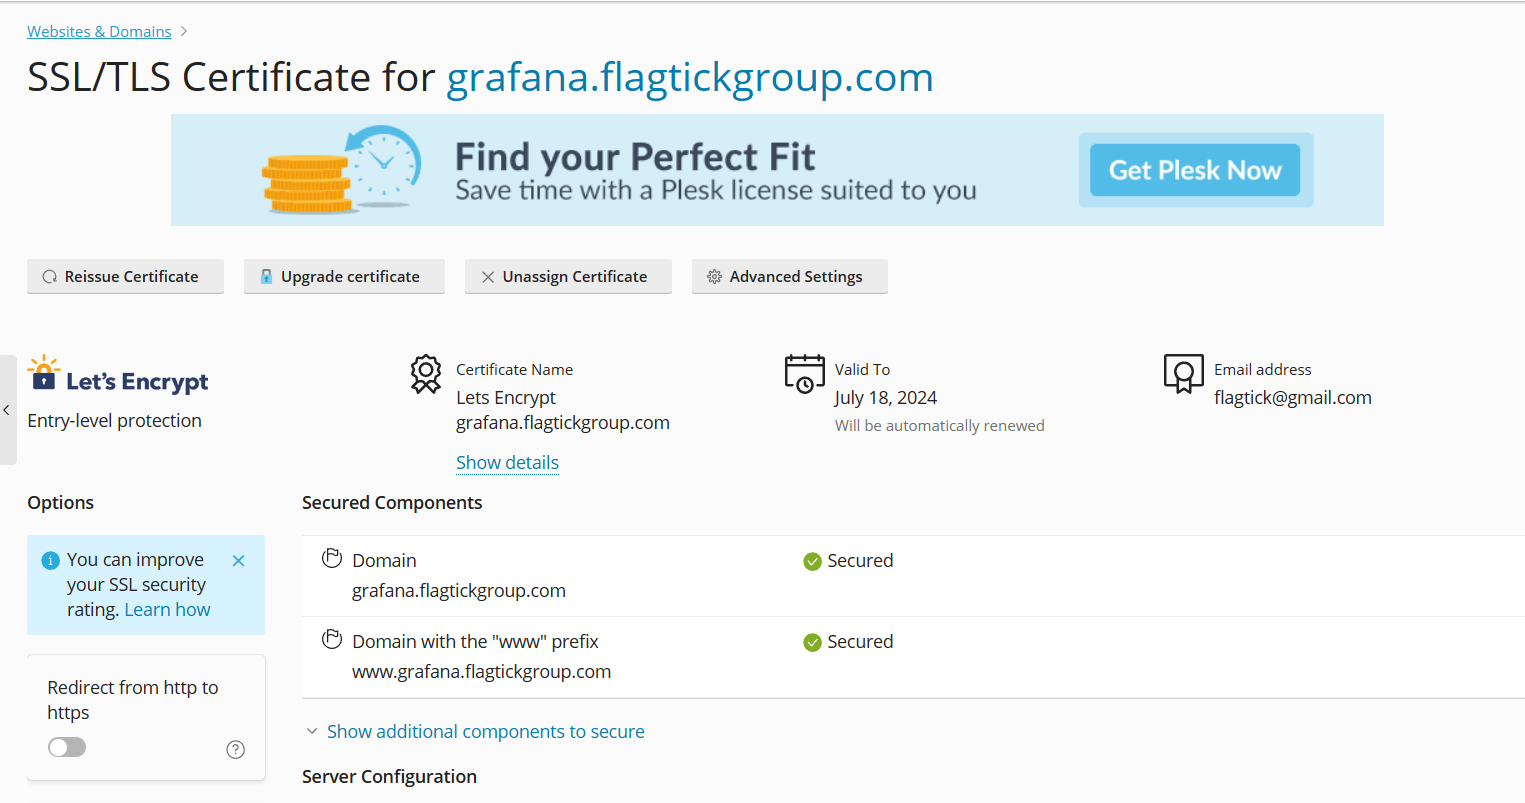
Started issuing a wildcard SSL/TLS certificate from Let's Encrypt for the domain grafana.flagtickgroup.com.
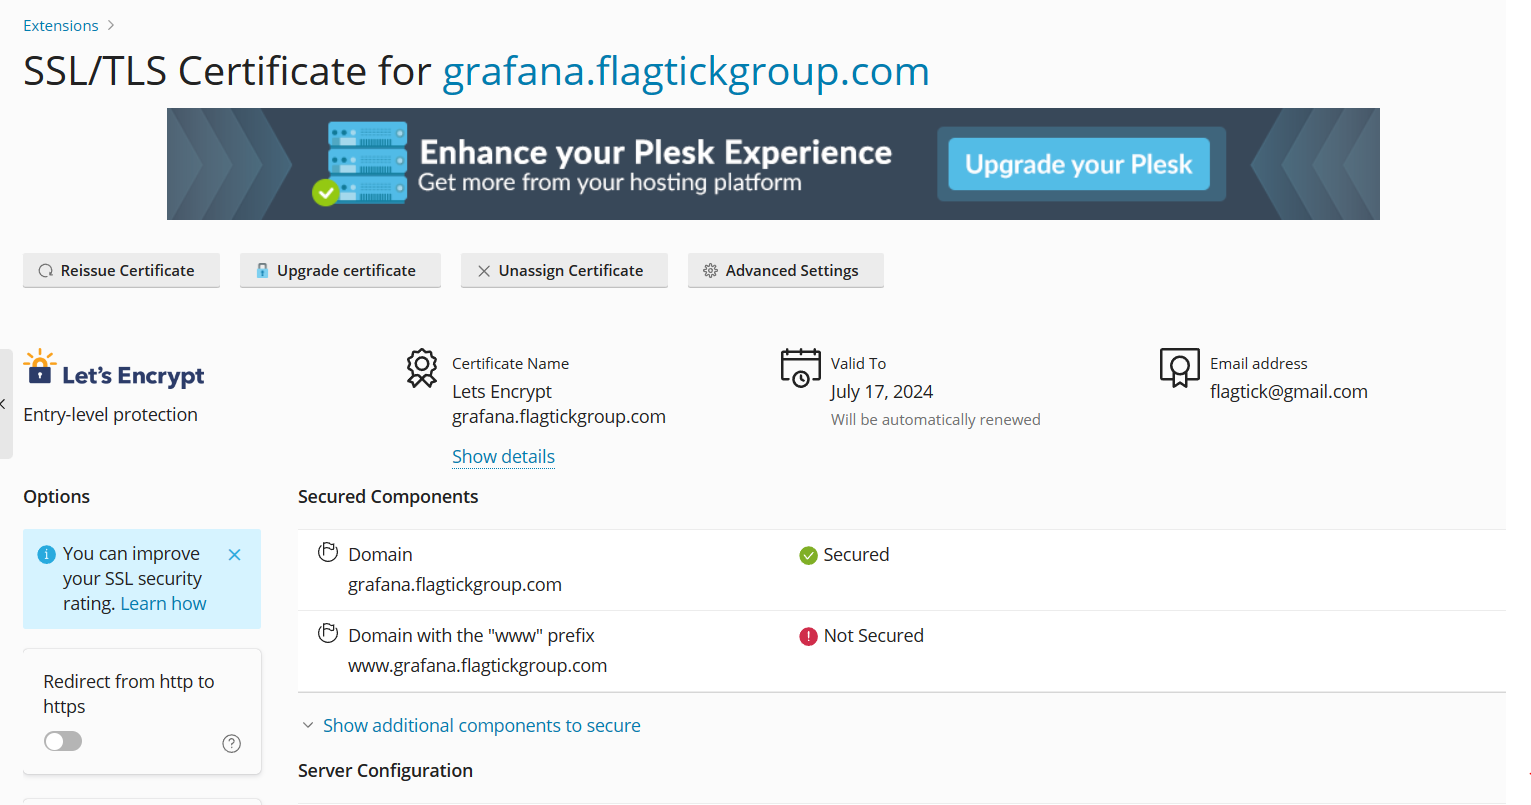
Here are the results after securing the domain and its www subdomain for the subdomain grafana.flagtickgroup.com.
You can view the details of this certificate and Plesk panel by examining it in plain text as follows:
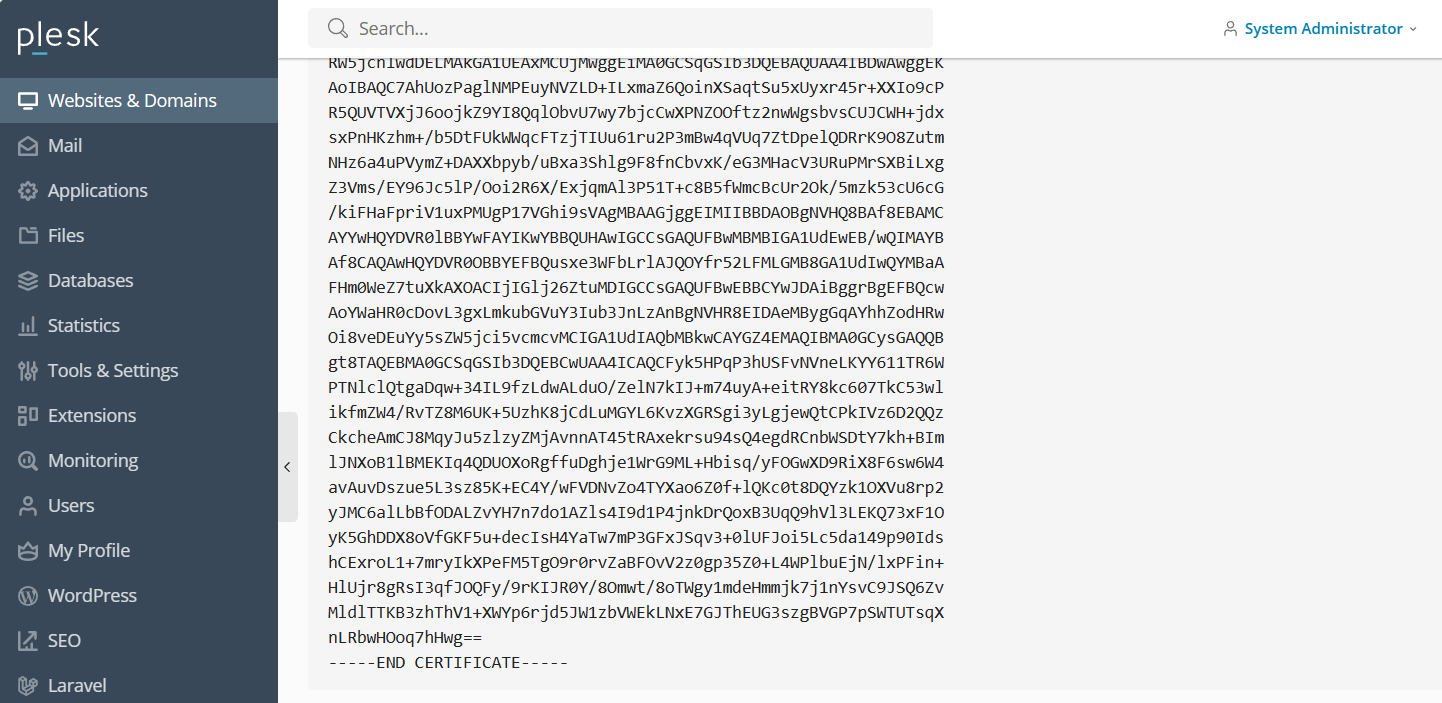
Moreover, you can execute the command $ sudo cat /var/www/vhosts/system/grafana.flagtickgroup.com/conf/httpd.conf to inspect all configurations and verify if the self-signed SSL certificate has been set up and configured for use with Apache.
<IfModule mod_ssl.c>
<VirtualHost 172.26.1.162:7081 >
	ServerName "grafana.flagtickgroup.com"
	ServerAlias "www.grafana.flagtickgroup.com"
	ServerAlias "ipv4.grafana.flagtickgroup.com"
	UseCanonicalName Off
	ProxyPreserveHost On
	ProxyPass / http://localhost:3030/
	ProxyPassReverse / http://localhost:3030/

	CustomLog /var/www/vhosts/system/grafana.flagtickgroup.com/logs/access_ssl_log plesklog
	ErrorLog "/var/www/vhosts/system/grafana.flagtickgroup.com/logs/error_log"

	DocumentRoot "/var/www/vhosts/flagtickgroup.com/grafana"

	<IfModule mod_suexec.c>
		SuexecUserGroup "flagtick" "psacln"
	</IfModule>

	<IfModule mod_userdir.c>
		UserDir "/var/www/vhosts/flagtickgroup.com/web_users/*"
	</IfModule>

	<IfModule mod_sysenv.c>
		SetSysEnv PP_VHOST_ID "4e78ba52-16fb-4c30-9cb9-fffa22b17566"
	</IfModule>

	Alias "/plesk-stat" "/var/www/vhosts/system/grafana.flagtickgroup.com/statistics"
	<Location  /plesk-stat/>
		Options +Indexes
	</Location>
	<Location  /plesk-stat/logs/>
		Require valid-user
	</Location>
	Alias /webstat /var/www/vhosts/system/grafana.flagtickgroup.com/statistics/webstat
	Alias /webstat-ssl /var/www/vhosts/system/grafana.flagtickgroup.com/statistics/webstat-ssl
	Alias /ftpstat /var/www/vhosts/system/grafana.flagtickgroup.com/statistics/ftpstat
	Alias /anon_ftpstat /var/www/vhosts/system/grafana.flagtickgroup.com/statistics/anon_ftpstat
	Alias /awstats-icon /usr/share/awstats/icon

	SSLEngine on
	SSLVerifyClient none
	SSLCertificateFile /opt/psa/var/certificates/scfu6Xa3R
	SSLCACertificateFile /opt/psa/var/certificates/scfNJGnJT

	<Directory /var/www/vhosts/flagtickgroup.com/grafana>
Thus, setting up SSL for Apache configuration can be achieved with just three lines, as shown below:
SSLEngine on
SSLCertificateFile /opt/psa/var/certificates/scfu6Xa3R
SSLCACertificateFile /opt/psa/var/certificates/scfNJGnJT
In some cases, missing proper folder permissions, ownership, or correct web server configurations can lead to a 403 Forbidden error when accessing the subdomain.
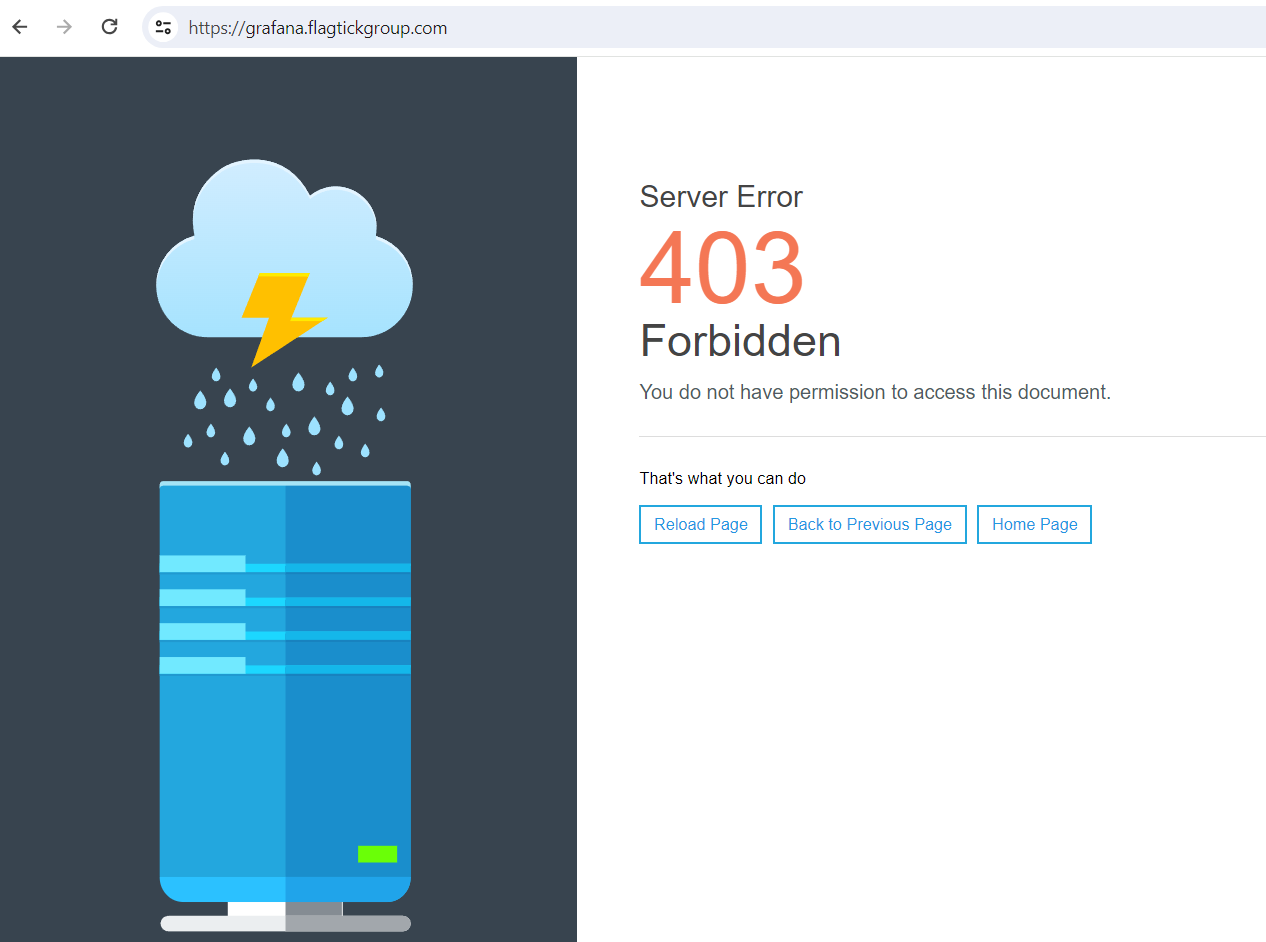
Navigate to the File Manager to access the Grafana folder, which is the directory pointed to by our subdomain. Here, you can examine the ownership settings for this folder.

Additionally, we can use the command ls -l to check the ownership of the Grafana folder.
$ ls -l /var/www/vhosts/flagtickgroup.com
...
drwxrwxrwx  2 ubuntu   ubuntu  4096 Apr 18 03:36 grafana
...
In Grafana, there are various authentication methods available, some of which also support syncing user permissions and organization memberships. We will dive deep into this further in the next section.
IV. Exploring Authentication Configuration in Grafana
Start by disabling all authentication methods except Basic authentication in Grafana. Access and modify the grafana.ini configuration file using a text editor or command-line tools like `cat /etc/grafana/grafana.ini`.
#################################### GitHub Auth ##########################
[auth.github]
;name = GitHub
;icon = github
;enabled = false
#################################### GitLab Auth #########################
[auth.gitlab]
;name = GitLab
;icon = gitlab
;enabled = false
#################################### Google Auth ##########################
[auth.google]
;name = Google
;icon = google
;enabled = false
#################################### Grafana.com Auth ####################
[auth.grafana_com]
;name = Grafana.com
;icon = grafana
;enabled = false
#################################### Azure AD OAuth #######################
[auth.azuread]
;name = Microsoft
;icon = microsoft
;enabled = false
;allow_sign_up = true
#################################### Okta OAuth #######################
[auth.okta]
;name = Okta
;enabled = false
#################################### Generic OAuth ##########################
[auth.generic_oauth]
;enabled = false
#################################### Basic Auth ##########################
[auth.basic]
enabled = true
#################################### Auth Proxy ##########################
[auth.proxy]
;enabled = false
#################################### Auth JWT ##########################
[auth.jwt]
;enabled = true
#################################### Auth LDAP ##########################
[auth.ldap]
;enabled = false
When you visit https://grafana.flagtickgroup.com/login, you're directed to the Grafana interface, but no login form appears.

To display the login form, you will need to set `disable_login_form` to false in `grafana.ini`. After making this change, restart the Grafana server using systemctl restart grafana-server to apply the updates.
[auth]
# Login cookie name
login_cookie_name = plesk_grafana_session

# Disable usage of Grafana build-in login solution.
;disable_login = false

# The maximum lifetime (duration) an authenticated user can be inactive before being required to login at next visit. Default is 7 days>
;login_maximum_inactive_lifetime_duration =

# The maximum lifetime (duration) an authenticated user can be logged in since login time before being required to login. Default is 30>
;login_maximum_lifetime_duration =

# How often should auth tokens be rotated for authenticated users when being active. The default is each 10 minutes.
;token_rotation_interval_minutes = 10

# Set to true to disable (hide) the login form, useful if you use OAuth, defaults to false
disable_login_form = false

# Set to true to disable the sign out link in the side menu. Useful if you use auth.proxy or auth.jwt, defaults to false
;disable_signout_menu = false
Note: For more information, you can visit the following URL: https://grafana.com/docs/grafana/latest/setup-grafana/configure-security/configure-authentication/grafana/.
Access your SQL database and reset the admin password using an SQL update query. Set the new password to admin.
sudo sqlite3 /var/lib/grafana/grafana.db
sqlite> update user set password = '59acf18b94d7eb0694c61e60ce44c110c7a683ac6a8f09580d626f90f4a242000746579358d77dd9e570e83fa24faa88a8a6', salt = 'F3FAxVm33R' where login = 'admin';
sqlite> .exit
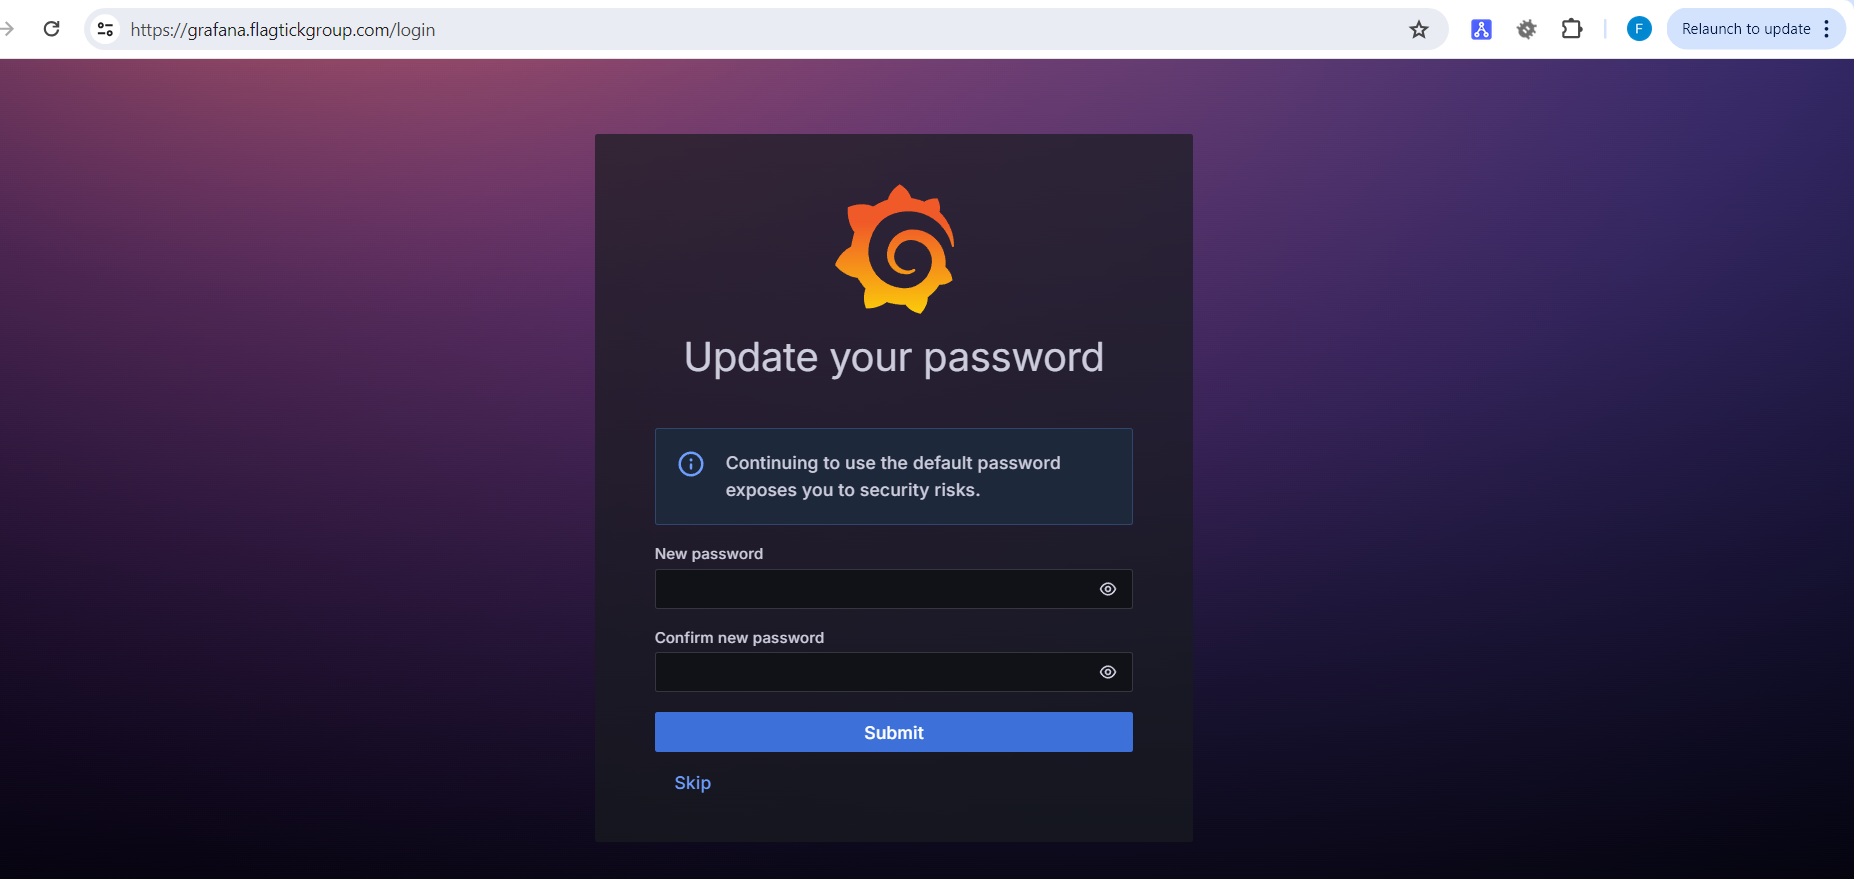
Once you log in with the username/password is admin/admin, you will be prompted with Update your password screen, where you can request to change your password as shown below:
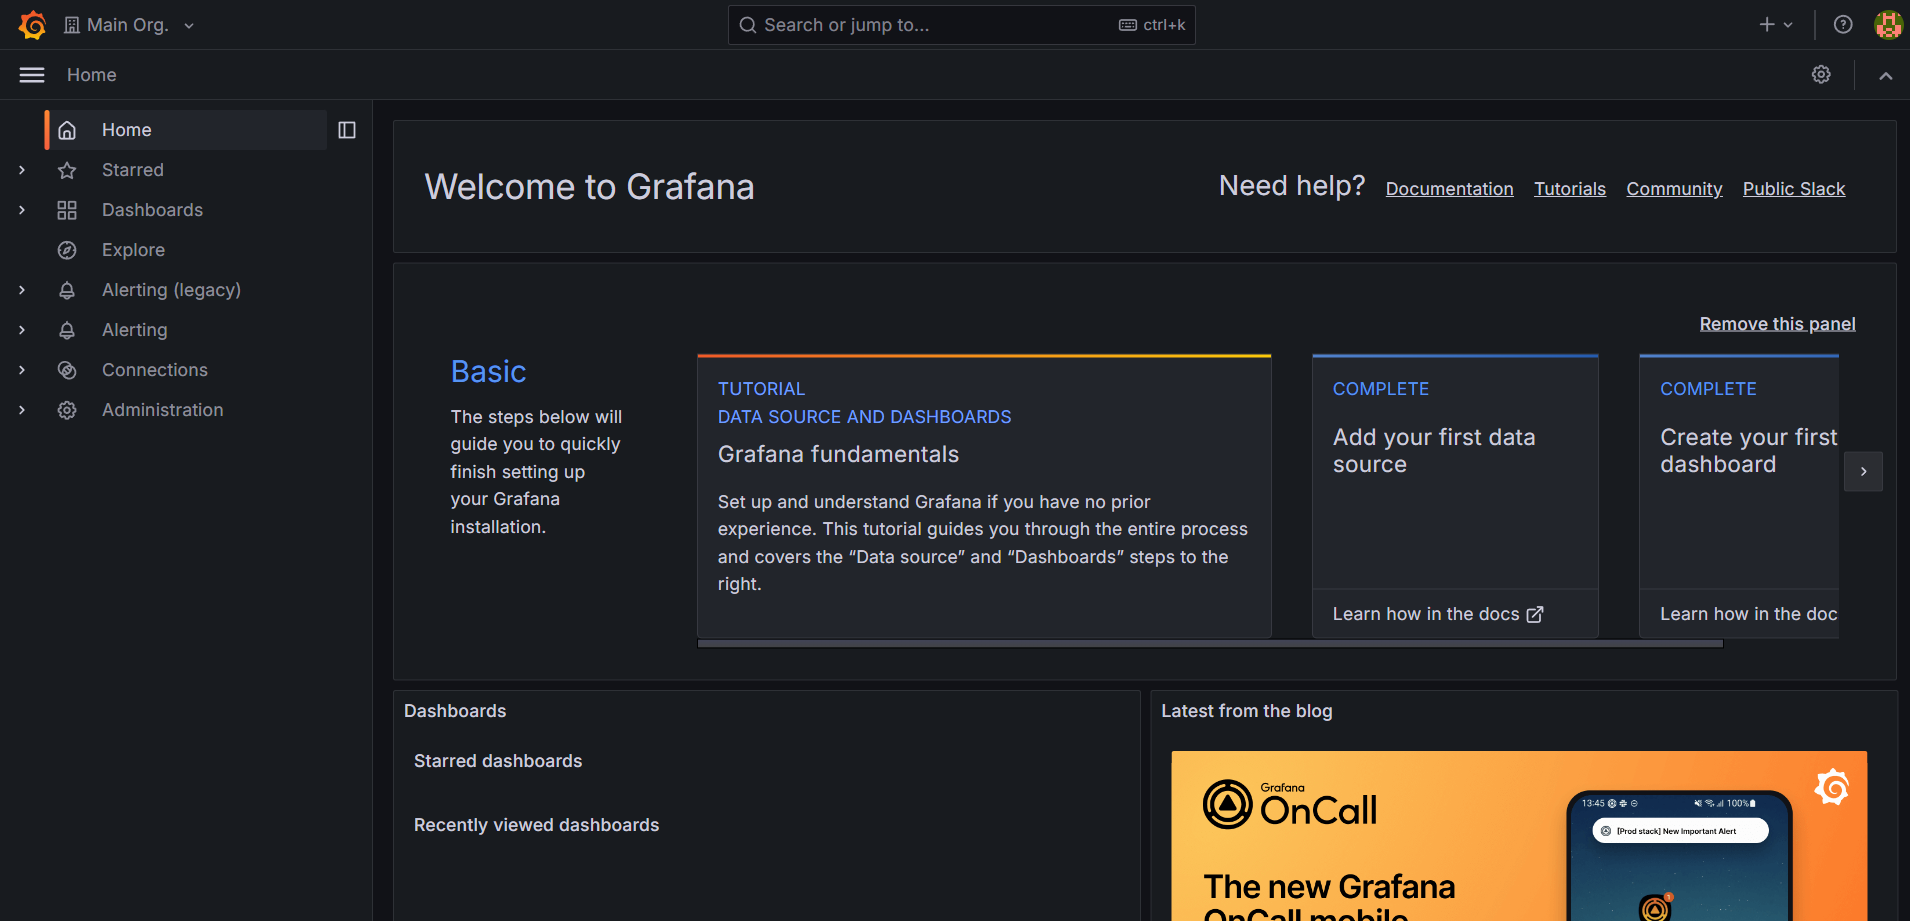
Finally, here is the Grafana dashboard after successfully changing the password.
V. Conclusion
Our article has shared practical insights on how to use Grafana for monitoring CPU, Disk, Memory, Network, Overview, and Services. We've included a detailed example of setting up Grafana on Ubuntu, covering installation, port configuration, and linking to a subdomain for easy browser access. If you encounter any issues while following our guide, don't hesitate to ask questions or share your concerns in the comments section.
VI. Video